Section 2.6 Clicker Problems
The graph of is shifted 3 units down and 7 units left.
Which of these is an equation for the new graph?A.
B.
C.
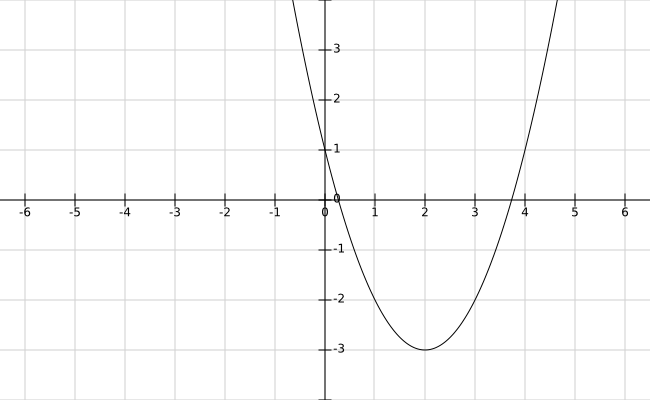
D.A translation of the graph of is shown below. Which of these equations corresponds to the graph?
A.
B.
C.
D.
Which of these describes the graph of ?
A. The graph of shifted down 4 and right 3
B. The graph of shifted up 3 and right 4
C. The graph of shifted up 3 and left 4
D. None of the aboveThe range of is . So, what is the range of ?
A.
B.
C.
D. None of the above