Example
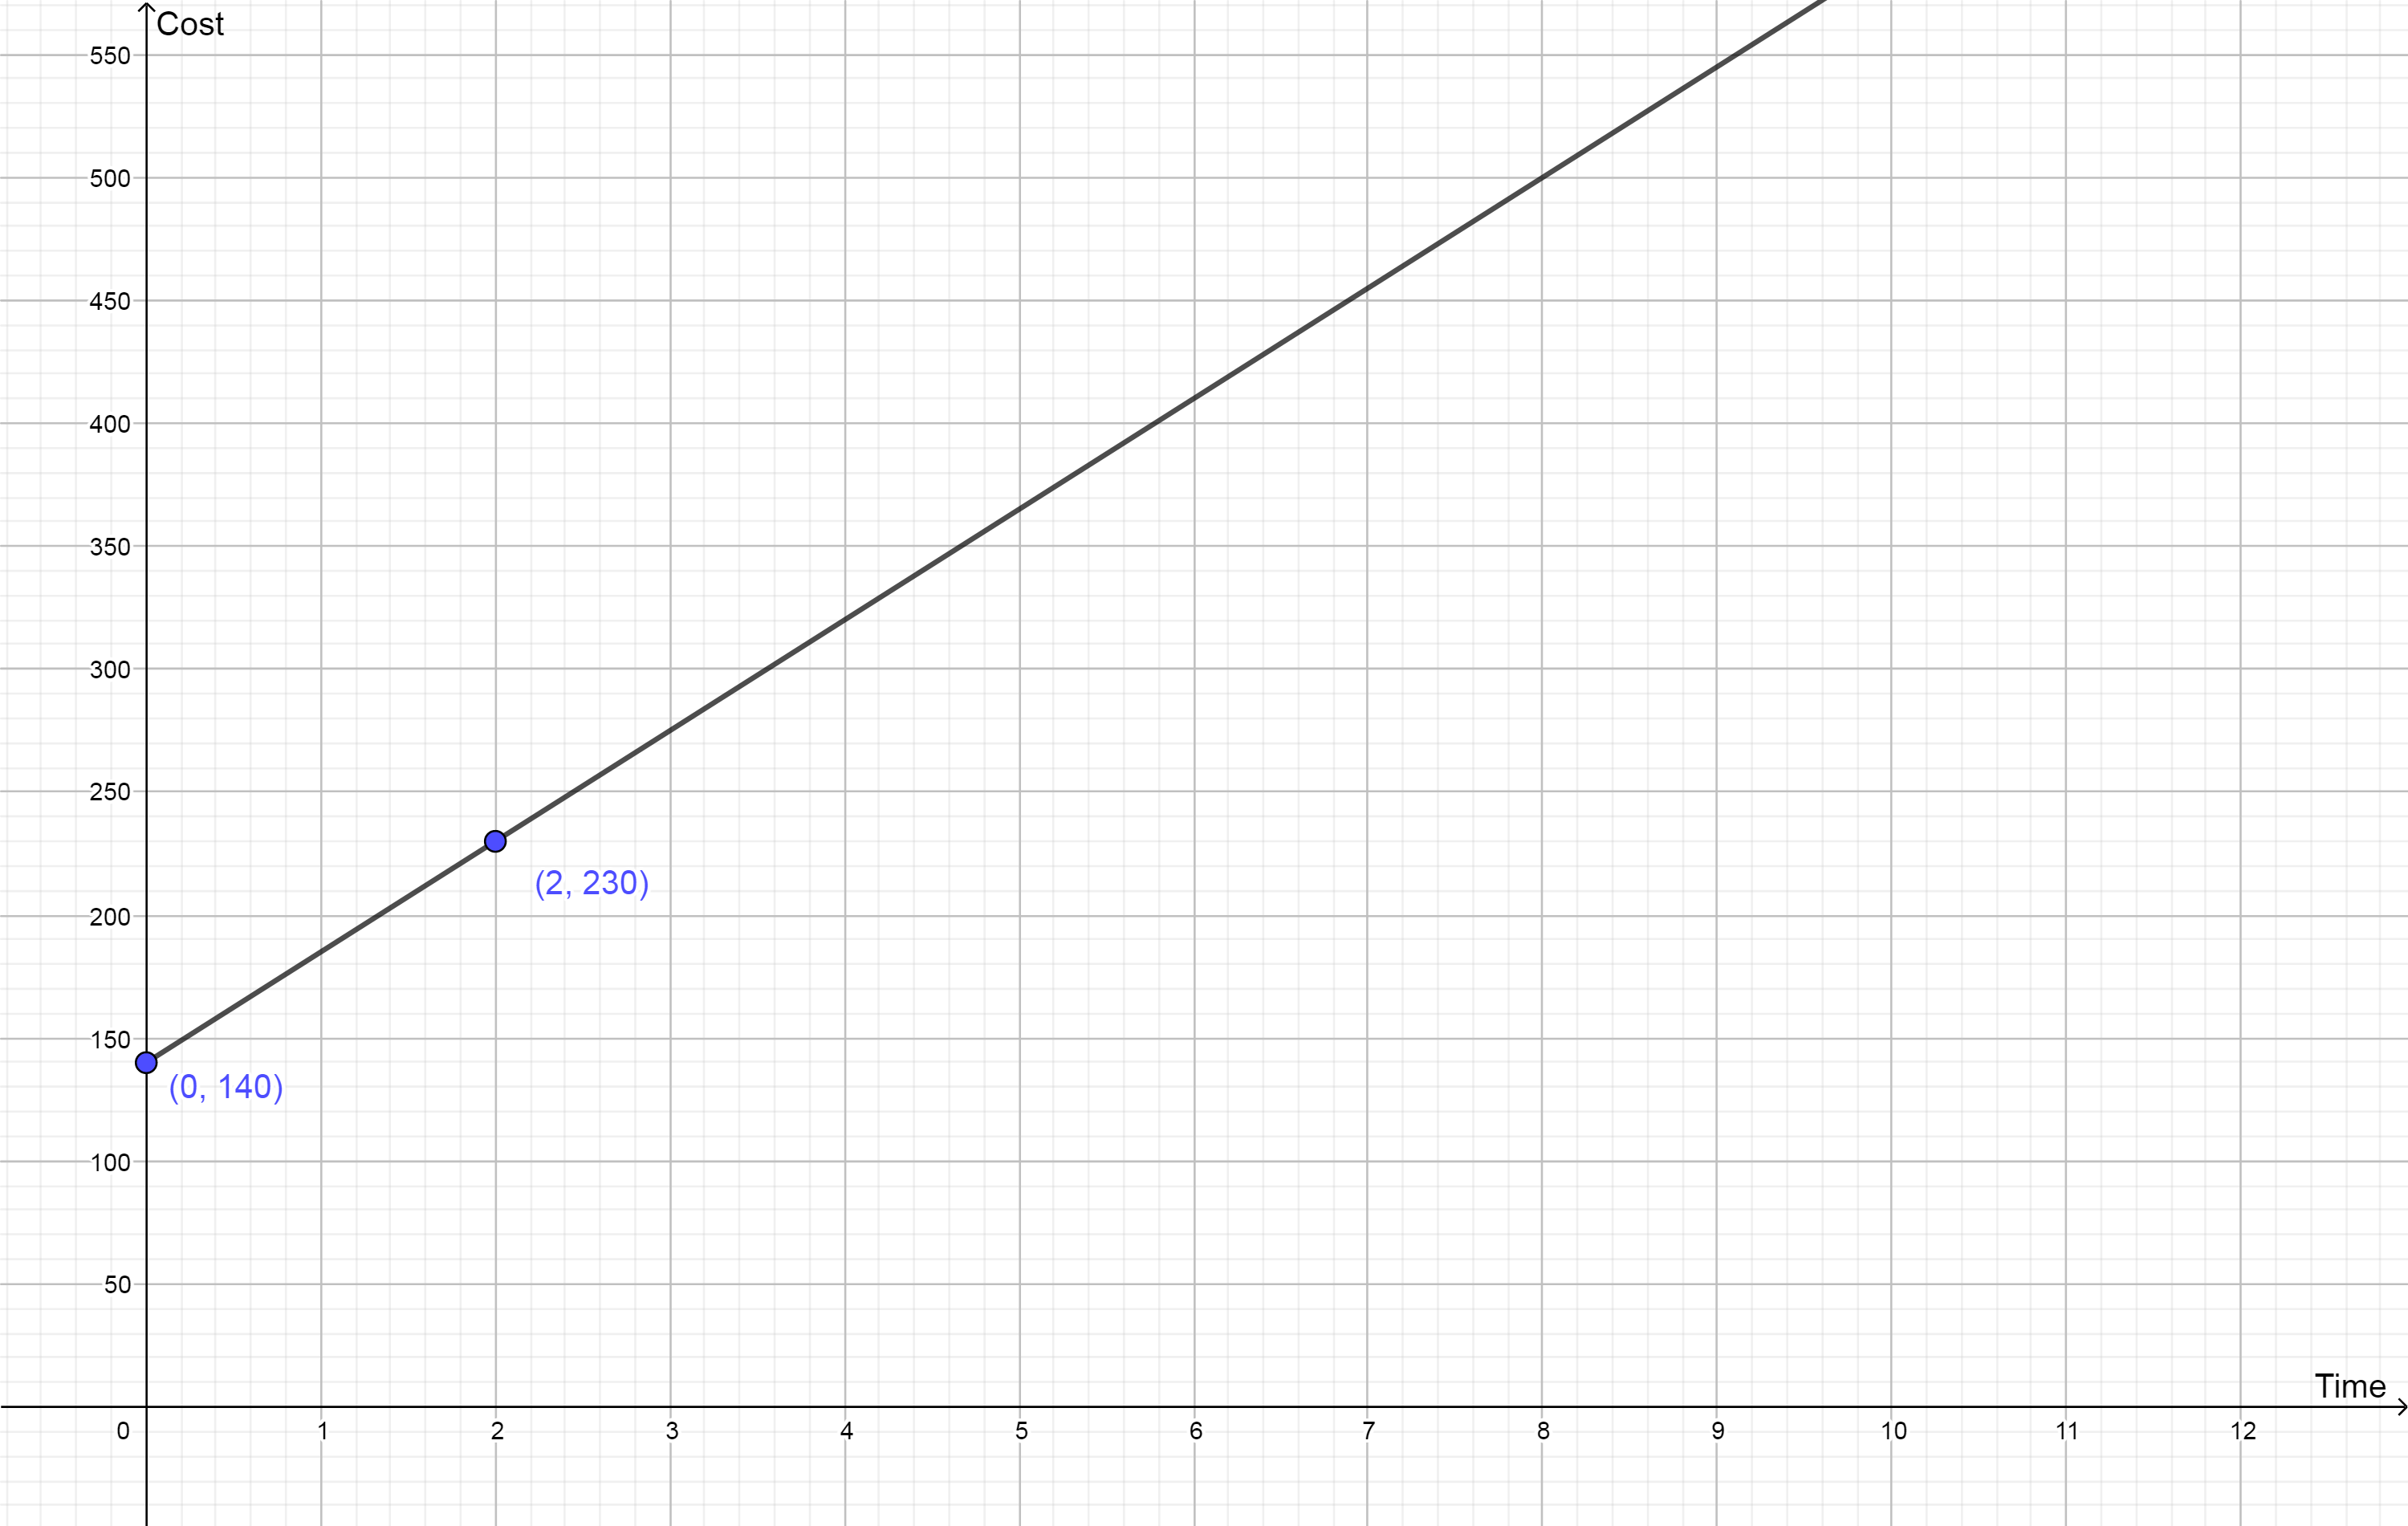
Sal fixes vintage arcade games. He charges a flat fee of $140 to make a house call, but then he charges a constant hourly rate on top of that. He recently made a house call to fix a Centipede game and ended up billing the a client $230 after 2 hours of work. Sketch the graph the shows how much Sal charges versus time (in hours). What does the slope of the graph represent?
Solution
Since Sal's hourly rate is constant, his fee and time satisfy a linear equation and the graph is a line. In fact, that line must pass through the points and . Do you understand where those points came from?
Let's find the equation of the line. It's slope is
The slope is Sal's hourly rate! He charges $45 per hour.
The flat fee is a fixed cost. In this example, that represents the -intercept, . With the slope and -intercept, we can write an equation:
The graph of cost versus time is shown below. Notice that the graph only exists for since Sal cannot work for a negative amount of time.
