Maxima Basics #4
Maxima Version 5.20.1
wxMaxima Version 0.8.4
(%i1) load(draw)$
(%i2) load("C:/Documents and Settings/Compaq_Owner/My Documents/Maxima/vect1.mac")$
(1)
2D Parametric curves defined by vector-valued functions...
(%i3)
/* Position vector */ r: [2*cos(t)-cos(2*t),2*sin(t)-sin(2*t)];
(%i4)
/* Velocity vector */ v: diff( r, t );

(%i5)
/* Acceleration vector */ a: diff( r, t, 2 );

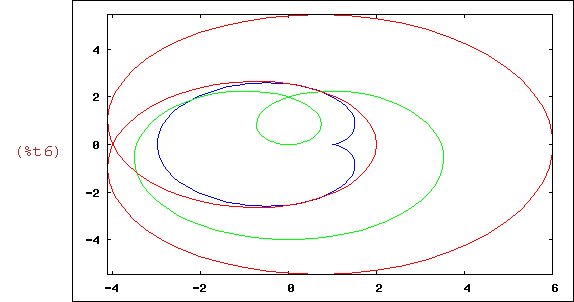
Sketch the graphs of position, velocity, and acceleration.
(%i6)
wxdraw2d( nticks = 100,
color = blue, parametric( r[1], r[2], t, 0, 2*%pi ),
color = green, parametric( v[1], v[2], t, 0, 2*%pi),
color = red, parametric( a[1], a[2], t, 0, 2*%pi )
)$
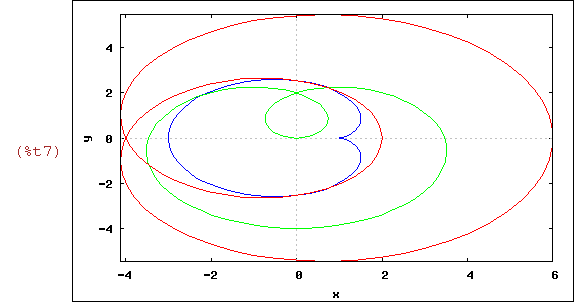
Add some details to the graph...
(%i7)
wxdraw2d( xaxis = true, xaxis_width = 2, xaxis_color = gray, xlabel = "x",
yaxis = true, yaxis_width = 2, yaxis_color = gray, ylabel = "y",
nticks = 100,
color = blue, parametric( r[1], r[2], t, 0, 2*%pi ),
color = green, parametric( v[1], v[2], t, 0, 2*%pi),
color = red, parametric( a[1], a[2], t, 0, 2*%pi )
)$
(2)
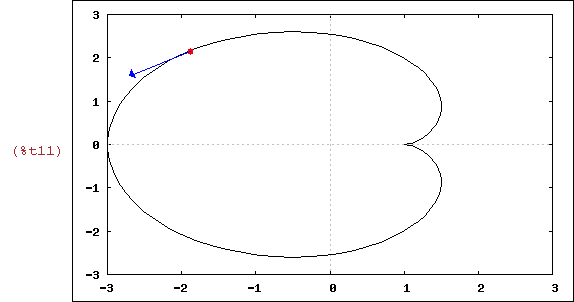
continuing with the same position vector as above...
(%i8)
/* Unit tangent vector */ T: normalize( v );

Sketch the graph of r(t) along with the tangent vector at t=2.5.
(%i9)
/* r(t) at t=2.5 */ rpt: at( r, t=2.5 );

(%i10)
/* T(t) at t=2.5 */ Tpt: at( T, t=2.5 );

(%i11)
wxdraw2d( xrange = [-3,3], yrange = [-3,3],
xaxis = true, xaxis_color = gray,
yaxis = true, yaxis_color = gray,
nticks = 100,
parametric( r[1], r[2], t, 0, 2*%pi ),
color = red, point_type = 7, points( [ rpt ] ),
color = blue, head_length = 0.1, vector( rpt, Tpt )
)$
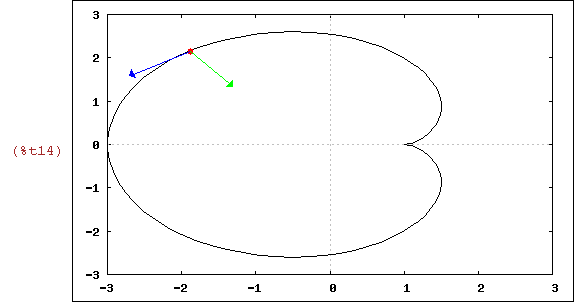
(3)
Continuing with the same position vector as above, add the principal unit
normal vector to the graph.
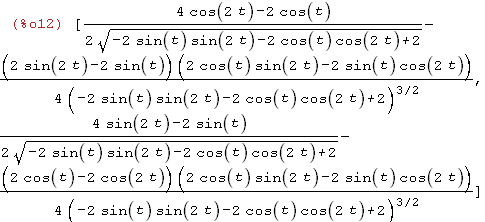
(%i12)
/* Compute T'(t) */ Tp: diff(T,t);
(%i13)
/* Principal unit normal at t=2.5 */ Npt: normalize( at( Tp, t=2.5 ) );

Npt doesn't look orthogonal to Tpt because of the aspect ratio of the viewing window.
(%i14)
wxdraw2d( xrange = [-3,3], yrange = [-3,3],
xaxis = true, xaxis_color = gray,
yaxis = true, yaxis_color = gray,
nticks = 100,
parametric( r[1], r[2], t, 0, 2*%pi ),
color = red, point_type = 7, points( [ rpt ] ),
color = blue, head_length = 0.1, vector( rpt, Tpt ),
color = green, vector( rpt, Npt )
)$
(4)
Continuing with the same position vector as above, compute the curvature at t=2.5.
(%i15)
/* Compute |T'(2.5)| */ temp1: norm( at( Tp, t=2.5 ) );
(%i16)
/* Compute |v(2.5)| */ temp2: norm( at( v, t=2.5 ) );

(%i17)
/* Curvature at t=2.5 */ Kpt: temp1/temp2;
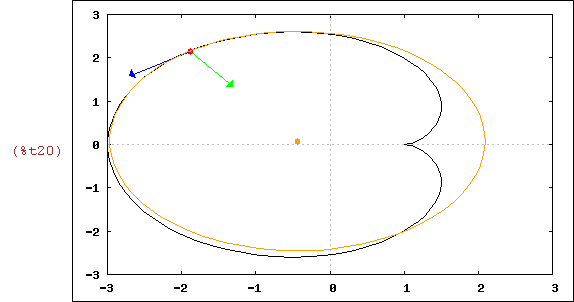
(5)
Continuing with the same position vector as above, sketch the circle of
curvature at t=2.5
(%i18)
radius: 1/Kpt;
(%i19)
center: rpt + radius*Npt;

(%i20)
wxdraw2d( xrange = [-3,3], yrange = [-3,3],
xaxis = true, xaxis_color = gray,
yaxis = true, yaxis_color = gray,
nticks = 100,
parametric( r[1], r[2], t, 0, 2*%pi ),
color = red, point_type = 7, points( [ rpt ] ),
color = blue, head_length = 0.1, vector( rpt, Tpt ),
color = green, vector( rpt, Npt ),
color = orange, points( [ center ] ),
transparent = true, ellipse( center[1], center[2], radius, radius, 0, 360 )
)$