Section 3.5 - Rational Functions and Asymptotes
Section Objectives
- Determine the vertical, horizontal, and/or slant asymptotes of the graph of a rational function.
- Sketch the graph of a rational function.
Rational Functions
A rational function is a ratio of two polynomials. That is, a rational function is a function of the form
where and are polynomials and .
The domain of a rational function is the set of all real numbers for which the denominator is nonzero. Earlier in the semester, we used the phrase "restricted values" to denote those numbers that made the denominator zero. The domain of a rational function is the set of all real numbers that are not restricted values.
Here are some examples of rational functions...
Reciprocal function
One of the simplest rational functions is the reciprocal function .
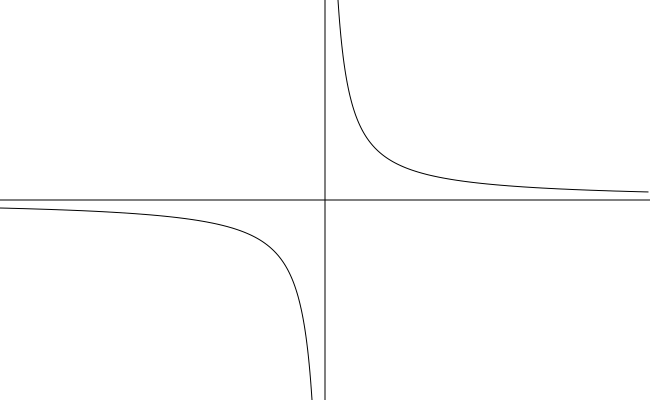
- Domain
- Range
- The reciprocal function is an odd function. Its graph is symmetric about the origin.
- As , . (The -axis is a horizontal asymptote of the graph.)
- As , . (The -axis is a vertical asymptote of the graph.)
The reciprocal function and its graph have some of the properties that will will see over and over again as we continue to study more complicated rational functions.
Asymptotes
The vertical line is a vertical asymptote of the graph of if the -values of grow without bound (positively or negatively) as the -values get closer and closer to (from either side).
IMPORTANT IDEA: The zeros of the denominator (restricted values) of a rational function give possible vertical asymptotes...
- The rational function has a vertical asymptote at if and .
- If and , simplify the rational expression, and then check again for the zeros of the denominator.
Examples
- Let . Determine the vertical asymptotes of the graph of . (Solution)
- Let . Determine the vertical asymptotes of the graph of . (Solution)
The line is a horizontal asymptote of the graph of if the -values of get closer and closer to the number as the -values grow without bound (positively or negatively).
IMPORTANT IDEA: Horizontal asymptotes can be found by examining the degrees of the numerator and denominator polynomials.
- If the degrees are equal, the horizontal asymptote is , where and are the leading coefficients of the numerator and denominator, respectively.
- If the degree of the denominator is greater than the degree of the numerator, is the horizontal asymptote.
- If the degree of the numerator is greater than the degree of the denominator, the graph has no horizontal asymptote.
While the graph of a rational function can have any number of vertical asymptotes, it can have at most one horizontal asymptote. (In general, functions can have at most two horizontal asymptotes---but rational functions can have at most one!)
Examples
- Determine the horizontal asymptote of the graph of . (Solution)
- Determine the horizontal asymptote of the graph of . (Solution)
- Explain how you know that the graph of has no horizontal asymptote. (Solution)
A non-horizontal or non-vertical line that a graph approaches as the -values grow without bound is called a slant (or oblique) asymptote.
- The graph of a rational function has a slant asymptote if the degree of the numerator is exactly one more than the degree of the denominator.
- To determine an equation for the slant asymptote, carry out long division: after long division, if the quotient is , then is an equation of the slant asymptote.
Example
- Let . Determine the slant asymptote and vertical asymptotes of the graph of . (Solution)
Graphing Rational Functions
Finding special features of the graph of a rational function (e.g., domain, asymptotes, intercepts) is not terribly difficult. However, getting a complete graph can be very challenging! For the most part, to graph a rational function, we will first find the interesting features, then plot some points and use graphing technology. Here are some useful steps (but you may not need all of them):
- Completely factor the denominator and specify all real numbers excluded from the domain of (restricted values).
- Completely factor the numerator and cancel any factors common to both the numerator and the denominator. (If any factors cancel, your graph will have holes at the corresponding -values.)
- Examine the factors that remain in the denominator. Then find and sketch the vertical asymptotes. (Sketch with a dashed line.)
- Find and sketch (dashed) any horizontal or slant asymptotes.
- Determine the - and -intercepts of the graph.
- To determine when the graph is above or below the axis, construct a sign chart: Away from your graph, sketch a number line separated (in order) by the -values associated with the vertical asymptotes, -intercepts, and other points excluded from the domain. Mark which is which. Then determine and mark the signs ( or ) of on each interval of your number line.
- Determine -values (if any) where the graph crosses the horizontal or slant asymptotes.
- Plot some points.
- Determine if there is symmetry in the graph.
- Use all the information above to sketch the graph. Use your graphing calculator as an aid.
Examples
- Sketch the graph of . (Solution)
- Sketch the graph of . (Solution)
For further help...
- Do a Google search for "graphing rational functions", "horizontal asymptotes", "vertical asymptotes", and/or "slant asymptotes".
- Video on intro to rational functions.
- Video on vertical asymptotes.
- Video on horizontal asymptotes.
- Video on slant asymptotes.
- Use Desmos or Geogebra to graph rational functions.