Example
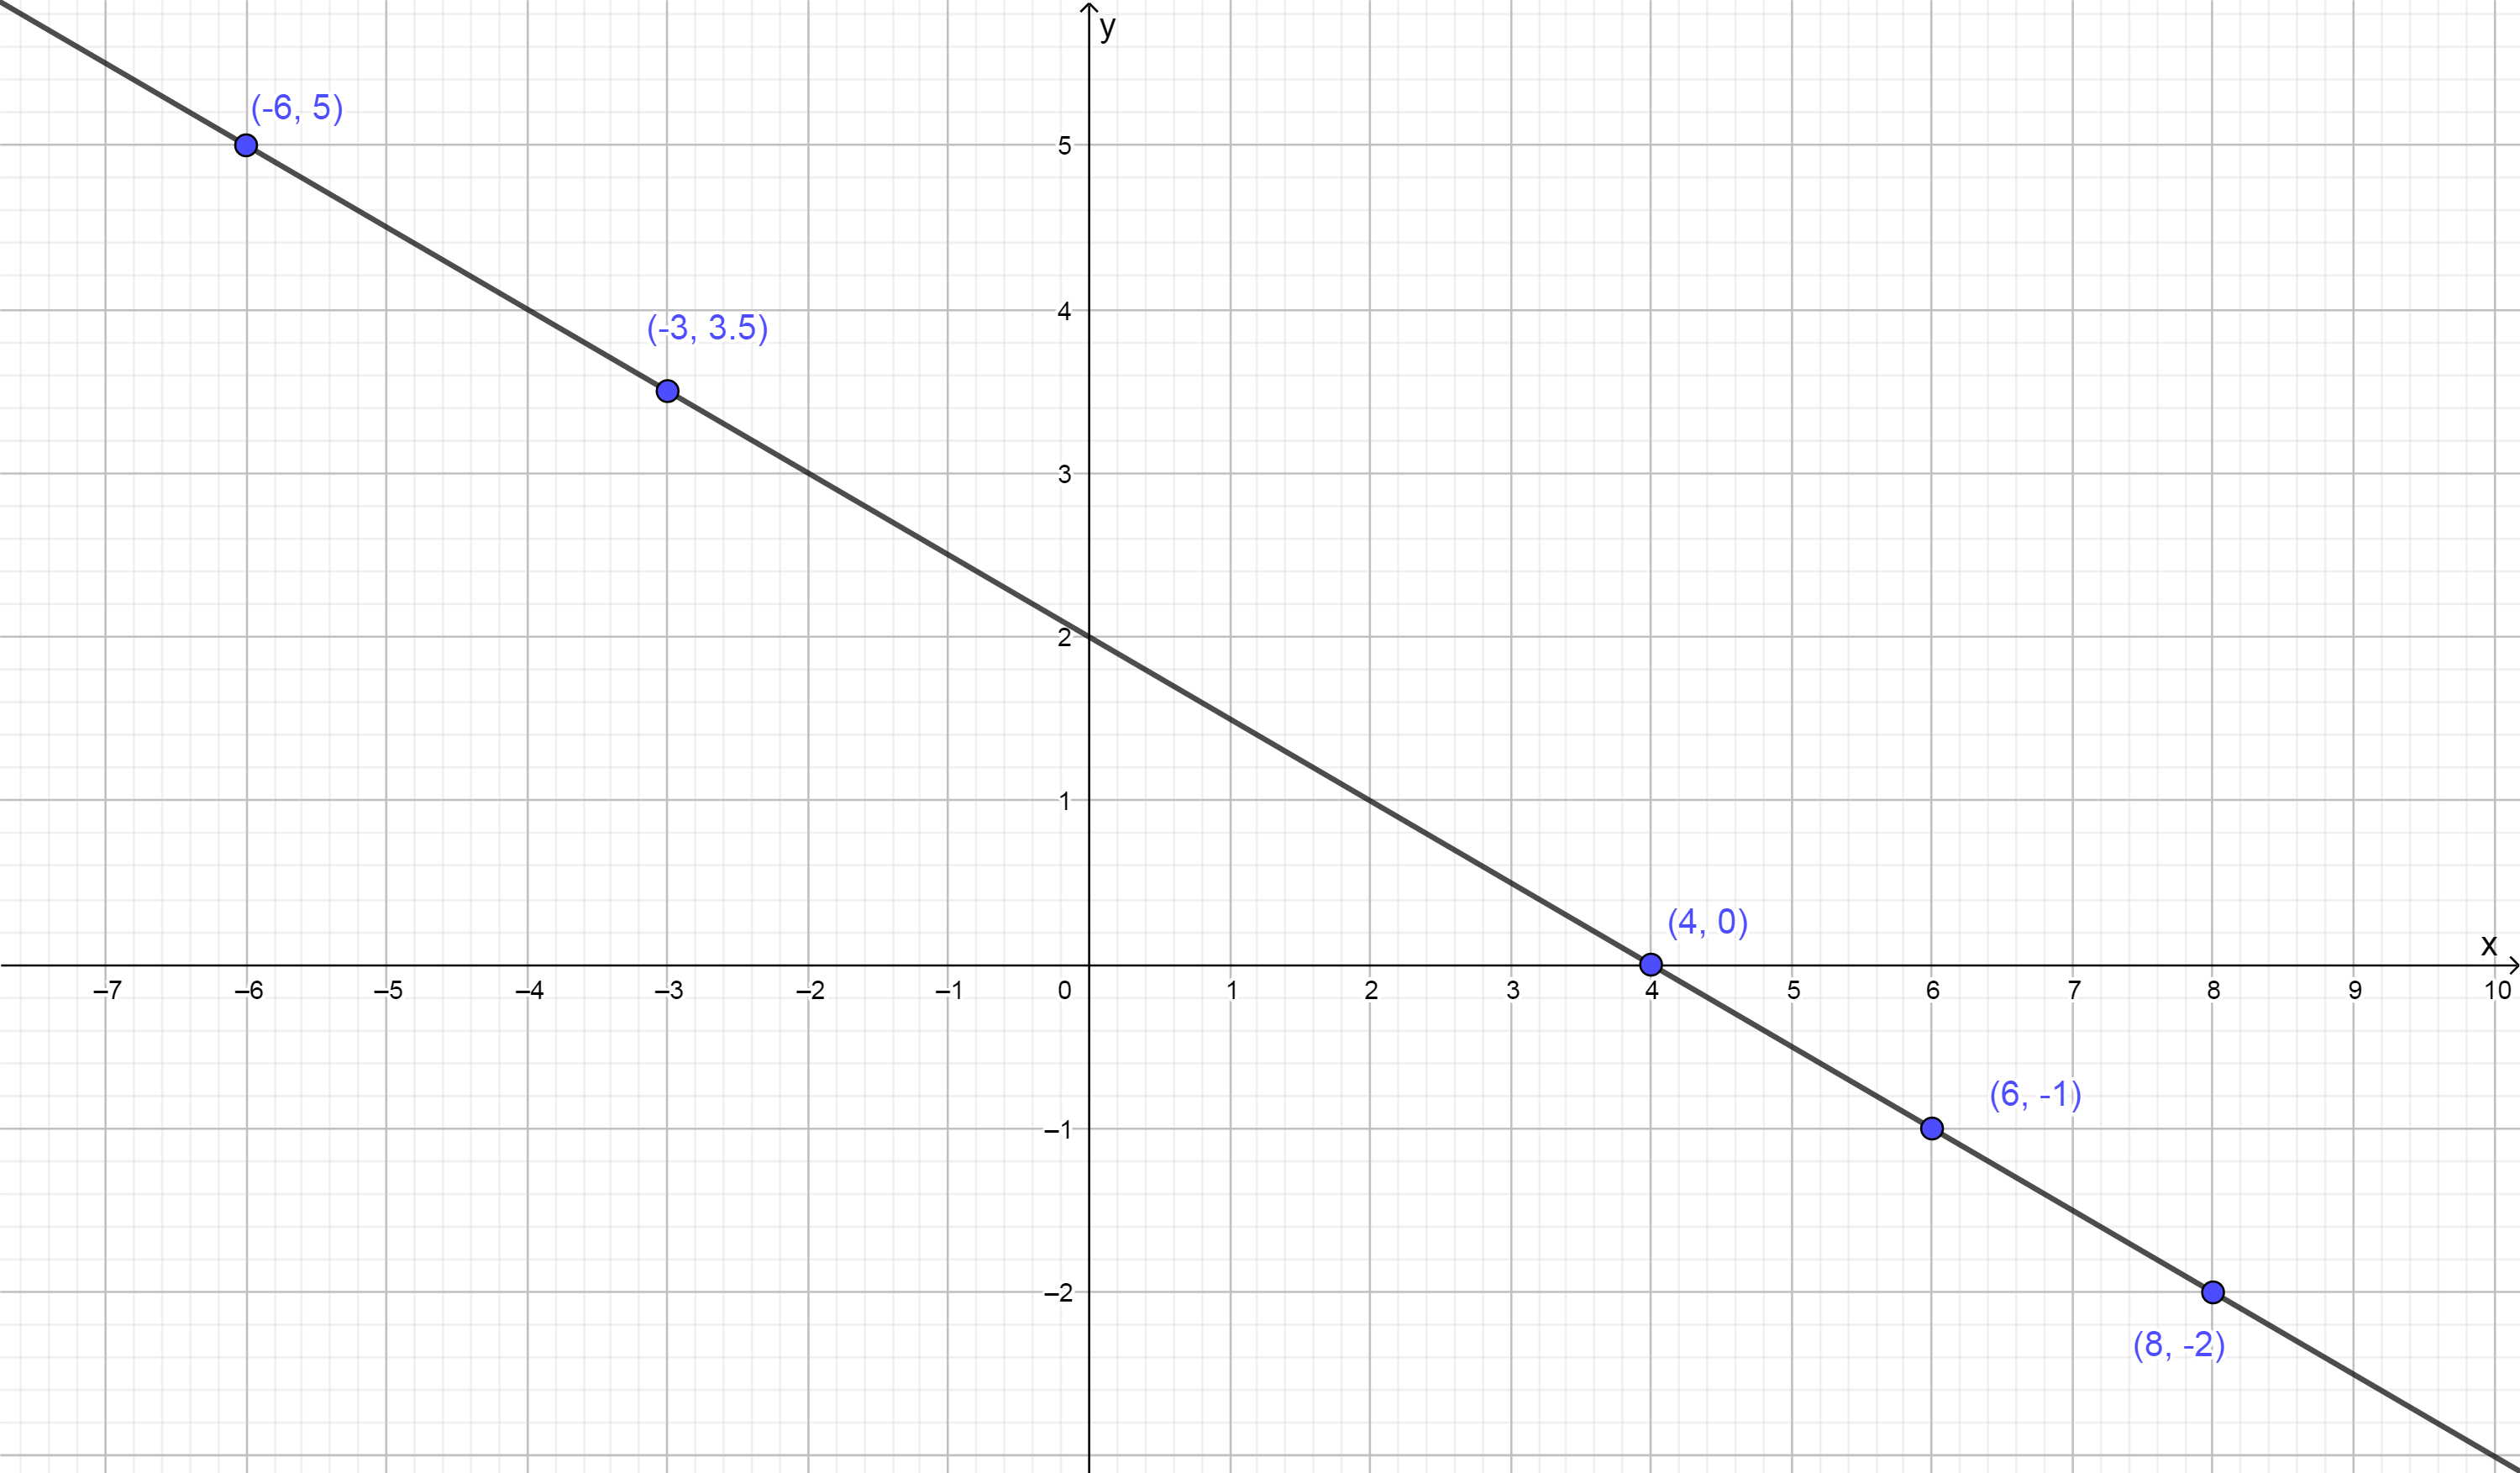
Find some points that solve , and then sketch the graph.
Solution
Let's choose five random values for either or and compute the value of the remaining variable.
Now we'll take the five points we found, plot them, and draw a smooth curve through the points. Our smooth curve should generalize the behavior we expect from the set of all solutions.